Note: This post originally appeared on my (discontinued) Gray Box blog on Aug 30, 2012.
Wherein I report preliminary results of my inquiry into student learning in my argument-based introductory history course. (Updated at bottom with some statistical details.)
It just makes sense that my inaugural post here addresses my own work in the Scholarship of Teaching and Learning (SoTL) in history. I’ve carried out several SoTL projects over the years — collecting and analyzing evidence of my own students’ learning — but I have for the first time collected data from a comparison group of students, and it is really interesting for me to see how my own students measure up against students in a similar course.
More specifically, I asked students in my introductory (early) American history course and in a colleague’s introductory (modern) American history course to explain, in their own words, “what historians do” and to give specific examples if possible.
It’s important to note that these were not questions that any of the students intentionally prepared to answer. Rather, students received a small amount of extra credit simply for responding briefly to these prompts after they completed their in-class final exams. (There was no added incentive to be especially thoughtful or complete.) In sum, I collected a set of over 150 quickly penned responses from students who were probably pretty tired of answering questions for professors.
I will have more to say about the data that I collected in due time, but I want to explain here that despite the limitations noted above, I was able to see marked differences between the responses of my students, who had just completed a question-driven, argument-based introductory history course, and responses of students who had taken a more standard history survey course (taught by an excellent teacher, by the way).
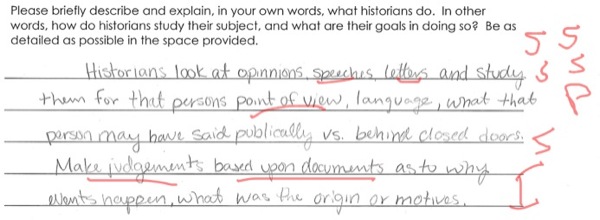
While the evidence that I collected was textual, and I will pay close attention to the language students’ used, I also analyzed the responses using a rubric, marking each one with a series of codes based upon the content of the response. (I have shared my rubric here.) I then entered the codes for each response into a spreadsheet for collective, quantitative analysis.
 Snippet from a coded response.
Here, perhaps, is the most striking number that emerges from the first 100 responses that I have analyzed. In the comparison class (44 responses), not one student (0%) mentioned a specific historian or scholar by name. In my class (56 responses), over 20% of students mentioned a specific historian by name, without being prompted to do so. (Yes, I realize that 20% is not a stunning number, but compared to 0% it looks pretty good!)
Why do I care if students mention specific historians when asked to give examples of what historians do? I don’t actually expect introductory-level students to have memorized historians’ names that they will remember over the long term. That’s not my goal. I do, however, want them to develop a deep and lasting awareness that to study history is to enter into an evidence-based discussion or debate. Those students who mentioned historians by name showed that they understood that history is not a simple description of the past produced by anonymous experts who are simply reporting indisputable facts. (By the way, I also coded for mentions of analysis and interpretation.) Here’s another area where my students out-performed the comparison group: about 37% of my students mentioned the idea of debate or discussion among historians, while only 14% of the comparison group referred to this aspect of studying history.
Again, I’ve just begun to analyze my data, and I will want to refine this study and collect additional evidence over subsequent semesters. But what I am seeing here is that my course design is making a difference in student learning. Having carried out this inquiry, I now have a more complex understanding of how my students think about history.
UPDATE (9/8/12): I have processed the remainder of my data from my spring 2012 students. Although the percentages changed a bit when I added in the second section of students, the basic trend is the same. With the help of my generous colleague Ryan Martin (Assoc. Professor of Human Development and Psychology at UW-Green Bay), I ran my data through SPSS and found that the major differences that I noted above between my students and the comparison students were statistically significant. For those of you who speak the language of statistics, the t-test when I compared the means for the total scores of my students versus the comparison students yielded a p-value of 0.001. (This means that assuming my data are good and the samples are representative, etc., the odds that this difference is the result of random chance, rather than a result of the differences between my course and the comparison course, is about one in one thousand.)